Performance Highlights
Showcasing
Resilient Performance
Operations
exceptional items
Employed
Capitalisation
Cost and Profit as a Percentage of Revenue from Operations
FY 2023-24
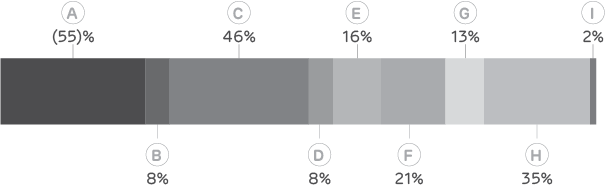
FY 2024-25
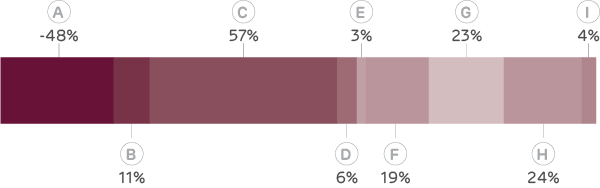
- A Profit Before Tax
- B Cost of Materials Consumed
- C Power and Fuel
- D Employee Cost
- E Freight and Forwarding Expense
- F Other Costs
- G Depreciation and Amortisation Expense
- H Finance Costs
- I Other Income
Margin and Efficiency
With the MSA and related party transactions (RPTs) with Adani Enterprises Limited (AEL), Ambuja Cements Limited (ACL), ACC, ACIL and/or wholly owned unlisted subsidiaries in place for the full year in FY 2024-25, the Company’s EBITDA margin before Exceptional Items for the reporting period improved to 10.5%, a notable increase from (9%) reported in FY 2023-24. Total sales for the year registered 17% growth, from H 820.17 crore in FY 2023-24 to H 962.60 crore in FY 2024-25.
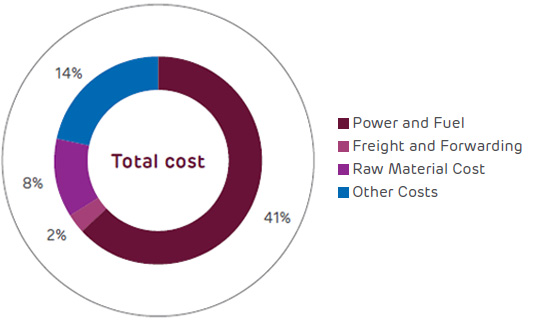
Cost Breakdown
Assets
The Company’s reported total assets amounted to H 3,733 crore with current assets representing 13% of the total assets during the review period.
Cash Flow
Over the past year, the Company has streamlined operations, optimised costs, and improved capacity utilisation with greater synergies with the Adani Group. Net cash used in operations during FY 2024-25 was H 252 crore, mainly due to an increase in Net Working Capital.
The MSA has enabled the Company to receive monthly advance payments for all orders, supporting its working capital needs, ensuring smooth operations and improving capacity utilisation.